Incidence and prevalence of circumcision in Australia
Updated January 2013
People often talk about the “rate” of circumcision but this can confuse two different ideas: incidence and prevalence. Incidence refers to the number of persons in a particular group who are circumcised each year; prevalence means how many in that group are currently circumcised. The prevalence of circumcision for newborn boys is zero, because none is born circumcised, but incidence is about 13% in the first year of life. On the other hand, annual incidence of circumcision for intact men in their 20s is about 0.07%, but prevalence in 2012 was estimated at 26%. Below we provide the most accurate estimates of circumcision incidence and prevalence for Australia available either on the Web or in print.
The vast majority of circumcisions in Australia have always been performed routinely on infants. By routine we mean surgery performed without medical indication. The opposite of routine is therapeutic, which means for the treatment of a disease or to correct an anatomical defect. Routine circumcision reached a peak of more than 80% in the 1950s, with most procedures performed on neonates before the birth discharge from hospital. Incidence has fallen steadily since the 1960s, so that today about 85% of boys start primary school still in possession of their foreskins. Further, only 25% of circumcisions for this age group are now performed in a hospital setting; the rest are done in doctors’ rooms, mainly by profit-oriented GPs rather than qualified surgeons working with anaesthetists in theatre.
Incidence
Children
The number of circumcisions for boys is the sum of Medicare rebates plus procedures performed on public patients in public hospitals. The latter is an important qualification because public hospitals progressively stopped offering this “elective procedure” from the 1990s, and from November 2007 none did (with very partial exceptions in Queensland and the Northern Territory). This is the main reason many people, looking only at Medicare rebates, have claimed that the “circumcision rate” has been going up, when in fact incidence has been very stable over the past decade and has recently begun a renewed decline.
Table 1
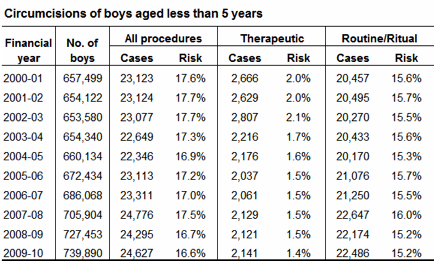
A reader asks if we can obtain a more recent picture of circumcision incidence that includes a State breakdown. There is at least a 2-year lag for release of the relevant hospital data, which are national only. But happily public hospital circumcisions have been of decreasing importance for preschool boys as elective procedures have been phased out. Since Medicare rebates were claimed for 94% of circumcisions in this age group in 2010, Medicare statistics – which are published at monthly intervals – can provide a more current snapshot of incidence, as well as allowing a State breakdown, with only a small loss of accuracy. In order to obtain a more sensitive measure for comparative purposes we can calculate a true rate: rebates per 1000 person-years in this case. The distinction between rate and risk is subtle but important: rate is what actually happened that year for all boys aged 0-4; risk is a prediction of what would happen for boys born that year were the rate to stay the same over the ensuing 4 years.
Table 2
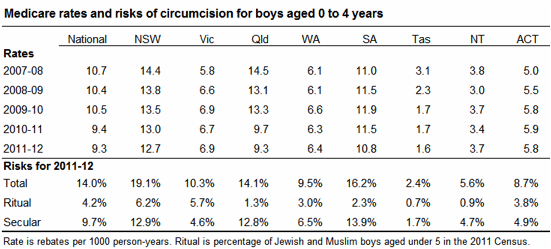
There are several points to note about this table. First, to obtain a total risk value comparable to that in Table 1, we must add 1 percentage point (based on 2010 data) to the national Medicare estimate. So the total national risk should be 15% in 2011-12, barring unforeseen changes in public hospital practices (for individual States and Territories the equivalent increments vary in ways that are difficult to measure precisely but fall in the range 0.5-1.5%). Second, Victorian and South Australian public hospitals still offered elective circumcision in 2007-08, so the small rate rises in Medicare rebates for these States largely reflected a move from publicly insured to fee-for-service rather than an increase in the actual number of procedures.
Third, and most important, it is now clear that after more than a decade of stability the incidence of infant circumcision started a renewed decline from 2008 in Queensland and NSW, the States with the highest incidence. This is not surprising given the falling prevalence among first-time fathers (see below). Finally, religious (ritual) circumcision is increasing in importance and now accounts for the majority of procedures in Victoria; as with Europe, being circumcised in Australia is becoming a marker of religious identity, with fewer than 10% of boys circumcised for secular reasons by the time they start school.
Incidence
Adults
Since Australian adults are only circumcised in a full surgical setting (public or private hospital, or private free-standing day surgery), we can ignore Medicare data and just use hospital Procedures data for estimates. However, we cannot use total population to calculate a rate, since only intact men can be circumcised. For this we need to know the circumcision prevalence, which was 58% in 2005 for males aged 15-64.
Table 3
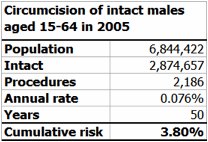
The table indicates that 96% of the 15-year-olds who were intact in 2005 will not be circumcised by their 65th birthday for any reason, if incidence remains the same. But will it? And what are the main reasons for adults being circumcised, anyway? We can use the Principal Diagnosis fields of the same hospital records to answer these questions for phimosis and routine (i.e. elective) circumcision, which combined constitute the reasons for more than 95% of all adult procedures. Table 4 shows the results for men in their 20s, who have seen the most dramatic decline in circumcision prevalence over the past two decades (see Prevalence below). Three-year averages were calculated to “smooth” any random variations in population estimates or case numbers.
Table 4
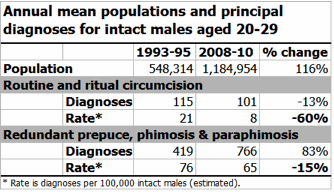
The most striking feature of this table is that as intact men move from being a minority to a large majority in their peer group, they are much less likely to opt for circumcision. This means that the already small risk of adult circumcision (incidence) is actually falling as circumcision prevalence falls.
Prevalence
Who has been circumcised?
The primary source for prevalence data is the Australian Studies of Health and Relationships, which has conducted large-scale scientific surveys of sexual health issues since 2001. Stratifying this information by birth year and place provides an excellent picture of the changing circumcision status of the adult population, including a breakdown into its Australian-born and overseas-born components (the latter now constituting 30% of the total male population).
Figure 1
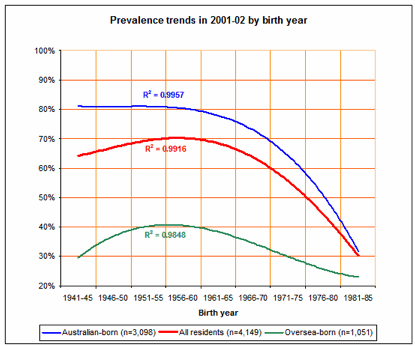
The 2005 intake of this survey confirmed these data and found that prevalence for those born in 1987-89 was 27%, which would indicate that the decline in incidence had started to “flatten out” at that time. It is important for a correct interpretation of this graph to understand that while the measured prevalence for all residents (the red line) born in the 1950s was 70% in 2001-02, it would have been higher in, say, 1960. That’s because net migration depresses total prevalence over time, as long as the blue line (Australian-born) is higher than the green line (overseas-born). Analysis of the latest Census data by country of origin indicates the circumcision rate of recent arrivals is about 15%, which means immigration continues to exert downward pressure on adult circumcision prevalence. Prevalence for Australian-born men closely approximates incidence for each birth year, given the relative rarity of adult circumcision. Another way of looking at the same dataset is to plot the prevalence for an age group over time. Again, it is men in their 20s who are of most interest, since it follows that whatever has happened to them will be the case for men in their 30s ten years later; that is, the circumcision prevalence of men aged 20-29 years in 2002 will closely correspond to that of those aged 30-39 in 2012, since they are largely the same people!
Figure 2
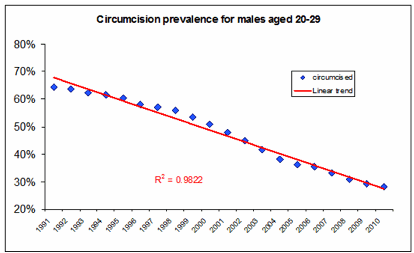
The fact that in 2005, for instance, 64% of these men were intact means that in 2015 about two-thirds of first-time fathers will also be intact, creating a demographic feedback loop that increasingly protects the next generation, since the biggest risk factor for infant circumcision is circumcised fathers. The trend (red line) shows a steady fall over 20 years of 2.1% a year. One important implication is that even with the active discouragement of routine circumcision by most of the medical profession, it still took two decades to effect a reversal of incidence (roughly from 70:30 to 30:70). This makes calls for “boosting” RIC as an alleged prophylaxis for certain adult sexual health issues particularly quixotic, since in addition to the lead time for the measure to be relevant (median ages of 34 and 69 years for HIV and penile cancer, respectively), one has to factor in the two or three decades it would take to reverse infant circumcision incidence from its current low level (assuming that were even possible, never mind desirable).
The final question many people ask about prevalence is: how many living males are currently circumcised? This inevitably involves a little more guess-work than the other calculations offered above, particularly for elderly males (born before WWII), but the last table offers a conservative estimate based on population data for 2011.
Table 5
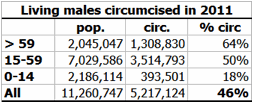
Note that even if incidence did not change, total prevalence would continue to fall as older males leave the population, largely intact birth cohorts enter, and younger males age.
Technical notes
- All years are financial years, ending June 30.
- Percentages and rates are variously rounded to reflect the error levels of the data represented.
- Sources: Medicare data are from the Health Insurance Commission. Hospital figures are from the National Hospital Morbidity Database, maintained by the Australian Institute of Health and Welfare, and populated by separation data provided by State and Territory health departments. Prevalence data are from the Australian Study of Health and Relationships. Population data are from the Australian Bureau of Statistics.
- Error margins: These apply to prevalence estimates and are inversely proportional to the square root of the sample size. For Figure 1 these average ±4.5% for each 5-year cohort. For Figure 2 these average ±3% for each data point. The 58% estimate for circumcision prevalence in 2005 has a margin of ±1.5%, so the risk calculation in Table 5 is ±0.13%. These margins are calculated at a 95% confidence level. Population data are ABS estimates and should not be considered accurate beyond the third decimal place (i.e. 100s).
- Incidence data only cover circumcisions performed in a medical setting, thus excluding boys circumcised by mohelim without a Medicare provider number and tribal circumcisions by Aboriginal people. These are unlikely to be statistically significant.
- Also excluded are persons who did not claim a Medicare rebate for which they were eligible. The number of such cases is unknown but, given the financial incentive to claim, it is probably quite small.
- There are two possible sources of double-counting, which would inflate incidence figures. The first is circumcised individuals who undergo a “circumcision revision”, which would be recorded simply as a new circumcision in the hospital or Medicare data; the second involves public patients who are nonetheless charged for surgical services (but not the hospital stay) and subsequently claim a rebate. The combined effect of these two factors is also difficult to quantify but probably equals or outweighs sources of under-counting identified in points 5 and 6.
© John Cozijn, 2013
This page is copyright. Any reproduction of this information, in whole or in part, must credit Circumcision Information Australia and/or provide a link to this page.
Questions or suggestions should be directed to the author at xeelee55@gmail.com
Update 2017: Sharp fall in Australian circumcision incidence
Figures from Medicare show that circumcision incidence in Australia continues to decline and is now at the lowest rate since records were kept. Between Financial Year 2009/10 and 2015/16 the number of circumcisions of boys under 6 months of age fell from 20,246 to 14,880 – a decline of about 30%. The fall was particularly dramatic in New South Wales (down from 8750 to 5923) and Queensland (down from 5611 to 3145). There were small falls in South Australia, the Northern Territory and the Australian Capital Territory, and slight rises in Victoria and Western Australia – where, however, the figures remain well below NSW and Qld (2943 and 1361 cases respectively). See Table 1 for details.
These figures are based on claims under Medicare item 30653, circumcision of a male under 6 months of age, and may not include all circumcision operations performed in Australia – those carried out as part of a childbirth “package”, for example, or by community operators, such as Mohels servicing the Jewish community. On the other hand, it is not likely that parents who arrange circumcisions with GPs and so-called specialist clinics would fail to claim the rebate, so it is likely that the figures give a reasonable approximation of the true picture. Even if they understate the incidence, the declining trend is obvious.
Although the majority of circumcision procedures are performed on baby boys under 6 months of age, significant numbers are also circumcised at later ages, and a few (very few) adults seek circumcision for their own personal reasons. Table 2 shows national figures for Medicare item 30656 (circumcision of a male between 6 months and 10 years of age); 30659 (circumcision of a male 10 years or over by a GP); and 30660 (circumcision of male 10 years or over by a specialist). From these it appears that while fewer boys between 6 months and 10 years are being circumcised, there is a slight increase in circumcision incidence among males 10 years or older.
Some of these are likely to be boys circumcised on the basis of a mistaken or spurious diagnosis of phimosis. Doctors warned some years ago that too many older boys were being circumcised for phimosis (foreskin tightness or non-retractability), without efforts having been made to treat the problem medically, such as with topical steroids. They further point out that this condition is usually a normal developmental stage that will usually resolve itself without treatment as the boy matures. Even where there is pain or discomfort, most cases of phimosis can be cured by application of topical steroids. Other reasons given for circumcision, such as balanitis (inflammation of the foreskin or glans) are equally suspect, as most of these conditions can be cured by application of appropriate medications or other non-surgical treatment. Research in Denmark has established that only a tiny percentage of boys need circumcision for medical reasons.
It is also likely that a further (but unknown) proportion circumcision procedures in the 10-years-plus category are competent adults (aged 18 years and above) who elect circumcision for themselves, but since Medicare does not provide a more detailed breakdown by age it is not possible to reach a definite conclusion on this point. Since Australian male births are currently running at nearly 160,000 per year, it is clear that the proportion of competent males seeking circumcision for themselves is extremely small.
The good news is that the incidence of circumcision among infants and young boys unable to give informed consent is declining steadily, and quite dramatically in the two “problem” states, New South Wales and Queensland. In calendar year 2015, the number of circumcision procedures performed on boys under 6 months of age was 15,176; in the same year, there were 157,088 male births, giving a circumcision incidence of 9.66%. In other words, the current incidence of circumcision in Australia is at its lowest level since records began.
Table 2: Claims for circumcision for boys aged over 6 months by Medicare item number
| Item No | Financial year | Financial year |
| 2009-2010 | 2015-2016 | |
| 30656 | 4274 | 3039 |
| 30659 | 694 | 897 |
| 30660 | 2523 | 3205 |
Table 1: Claims for circumcision of boys aged 6 months and under, by financial year and state
| Year | NSW | Vic | Qld | SA | WA | Tas | ACT |
| 2009/10 | 8750 | 2919 | 5611 | 1566 | 1117 | 50 | 178 |
| 2010/11 | 8521 | 2992 | 4036 | 1563 | 1104 | 43 | 197 |
| 2011/12 | 8524 | 3170 | 3936 | 1523 | 1168 | 44 | 208 |
| 2102/13 | 7758 | 3007 | 3710 | 1536 | 1268 | 47 | 208 |
| 2013/14 | 7288 | 3019 | 3478 | 1487 | 1283 | 47 | 230 |
| 2014/15 | 6841 | 3097 | 3140 | 1275 | 1277 | 56 | 151 |
| 2015/16 | 5923 | 2934 | 3145 | 1304 | 1361 | 61 | 112 |
Table 1 (Continued)
| Year | NT | Total Aust |
| 2009/10 | 55 | 20246 |
| 2010/11 | 47 | 18503 |
| 2011/12 | 43 | 18616 |
| 2012/13 | 44 | 17578 |
| 2013/14 | 47 | 16897 |
| 2014/15 | 52 | 15889 |
| 2015/16 | 40 | 14880 |
Figures derived from statistics kept by Medicare at http://medicarestatistics.humanservices.gov.au/statistics/mbs_item.jsp